What is User Behavior Analysis (UBA)? An Overview and How to Proceed
 User Behavior Analysis (UBA) is a method of investigating user actions and understanding their needs. With the advancement of web technology, not only lifestyles but also work and business efficiency have improved, and marketing is no exception.
For instance, if you operate an e-commerce site, it’s now possible to grasp the actions of site visitors. User Behavior Analysis refers to the method of researching these user actions to understand their needs.
In this article, we will explain User Behavior Analysis, covering everything from its overview to specific methods in an easy-to-understand manner.

What is User Behavior Analysis (UBA)?
User Behavior Analysis (UBA), or User Behavior Analytics, focuses on analyzing users’ actions, thoughts, and needs. Companies use UBA to gather information that can inform their subsequent marketing activities.
Incorporating User Behavior Analysis into Web Marketing
Web Marketing is a method of building a system for attracting customers online and monetizing them. In Web Marketing, setting targets and personas is essential. User Behavior Analysis is often used in this process.
Specifically, it involves estimating the characteristics of site visitors based on their device, login information, and activities within the web. Normally, analysis and measurement tools are used to investigate the behavioral patterns of site visitors. This can lead to understanding what kind of articles the target users are interested in.
Benefits of User Behavior Analysis
There are several benefits to performing User Behavior Analysis.
- It serves as a reference for structuring the site.
- It clarifies the content that should be created.
Reference for Site Structuring
Data obtained from User Behavior Analysis can be a foothold in structuring a website. When operating a website, it’s necessary to consider the site’s directory structure and internal linking.
User Behavior Analysis can reveal:
- The most common inflow routes (e.g., many via Google search engine).
- Which pages receive the most inflow.
- How users navigate within the site.
This information can help determine effective categories to add or where to place internal links.
Identifying Content to Create
User Behavior Analysis can reveal which pages attract the most access, thereby clarifying what content should be prepared next. Additionally, the data obtained can serve as a reference for understanding users’ search intentions, aiding in page creation.
For example, suppose you prepare two articles: “Review of Soy Sauce Flavored Cup Ramen” and “Review of Salt Flavored Cup Ramen.” If you check the access data after placing prominent mutual links in the lead sections of these two pages, you might find that the page/session (page per session) is 1.5 pages.
This means that one in two page visitors is navigating between these two pages.
From this, you can hypothesize that people who read one review are interested in other flavors as well. Therefore, creating a “Review of Miso Flavored Cup Ramen” could further increase the site’s navigation rate.
Points to Note in User Behavior Analysis
When conducting User Behavior Analysis, pay attention to the following points:
- Focus on the behavioral patterns of personas and targets.
- If the denominator of user numbers is small, the data may not be useful.
- Data analysis without understanding the field can be dangerous.
Focusing on the Behavioral Patterns of Personas and Targets
User Behavior Analysis is about analyzing behavioral patterns. Be careful not to confuse it with setting attributes.
In marketing, targets and personas are usually defined, and attributes such as name, age, and gender are set. On the other hand, User Behavior Analysis is a strategy that focuses on the specific actions of personas to draw out their thoughts and needs.
Data May Not Be Useful If User Numbers Are Low
User Behavior Analysis is based on user logs. Normally, if the sample size does not reach a certain level, the data may not be useful. This is known as the convergence of probability in statistics.
For example, the probability of rolling a six on a die is one in six. However, if you roll the die only once and it lands on five, the data would suggest a 100% probability of rolling a five and a 0% probability of rolling a six. However, as you increase the number of rolls, the average probability of rolling a six approaches the correct value of one in six.
Due to this statistical principle, be aware that accurate analysis is not possible if the sample of users is too small.
Danger of Analyzing Data Without Knowing the Field
There is a risk of conducting incorrect data analysis without a deep understanding of the field situation or users’ search intentions.
For example, suppose there is an article on a website that attracts a lot of access. Analyzing this article without information about its value or what resonates with users can be challenging. Therefore, always consult with the content director or writer who was responsible for the article.
User Behavior Analysis (UBA) Framework
In advancing user behavior analysis, there is a basic conceptual template known as a framework. The following are some of the frameworks used in user behavior analysis:
- RFM Analysis
- Decile Analysis
- Behavioral
RFM Analysis
RFM Analysis is a method used to rank users and develop appropriate strategies for each group. RFM stands for:
- Recently (Date of Purchase)
- Frequency (Frequency of Purchase)
- Monetary (Amount of Purchase)
In RFM Analysis, user behavior patterns are analyzed focusing on purchases. Users are ranked based on rules like:
| Rank | Date of Purchase | Frequency of Purchase | Amount of Purchase |
|---|---|---|---|
| Rank 1 | Within 1 week | More than 20 times | More than 200,000 yen |
| Rank 2 | Within 1 month | More than 10 times | More than 100,000 yen |
| Rank 3 | Within 6 months | Less than 10 times | Less than 100,000 yen |
Appropriate strategies are then developed for each rank.
Decile Analysis
Decile analysis refers to a method of grouping users based on their purchase amounts. In decile analysis, we focus on analyzing behavior patterns based on the amount spent on purchases.
Specifically, it involves arranging past purchase histories in descending order of purchase amounts and then dividing them into ten equal parts. Then, detailed data such as the ratio of purchase amounts for each purchasing group and the average purchase amount per person are calculated. For example, let’s say there are 100 users with a total purchase amount of 1 million yen. In this case, the users are divided into ten equal groups as follows.
Decile Number of Users Total Purchase Amount
| Decile | user | Total Purchase Amount |
|---|---|---|
| Decile 1 | 10 people | 500,000 yen |
| Decile 2 | 10 people | 300,000 yen |
| Decile3 | 10 people | 100,000 yen |
| Decile4 | 10 people | 50,000 yen |
| Decile5 | 10 people | 30,000 yen |
| Decile6 | 10 people | 10,000 yen |
| Decile7 | 10 people | 5,000 yen |
| Decile8 | 10 people | 3,000 yen |
| Decile9 | 10 people | 1,000 yen |
| Decile10 | 10 people | 500 yen |
Metrics used in Decile Analysis include purchase amount ratio, cumulative purchase amount ratio, and average purchase amount per person.
Furthermore, decile analysis employs the following metrics:
- Purchase Amount Ratio
- Cumulative Purchase Amount Ratio
- Average Purchase Amount per Person
Among these, the Cumulative Purchase Amount Ratio refers to the proportion of the total value up to the relevant decile in comparison to the overall total. Applying this to the case in the table above, the metrics would be as follows:
| Decile | Purchase Amount Ratio | Cumulative Purchase Amount Ratio | Average Purchase Amount per Person |
|---|---|---|---|
| Decile1 | 50% | 50% | 50,000 yen |
| Decile2 | 30% | 80% | 30,000 yen |
| Decile3 | 10% | 90% | 10,000 yen |
| Decile4 | 5% | 95% | 5,000 yen |
| Decile5 | 3% | 98% | 3,000 yen |
| Decile6 | 1% | 99% | 1,000 yen |
| Decile7 | 0.5% | 99.5% | 500 yen |
| Decile8 | 0.3% | 99.8% | 300 yen |
| Decile9 | 0.15% | 99.95% | 150 yen |
| Decile10 | 0.05% | 100% | 50 yen |
As can be seen from this table, strategies for users should be more focused on the higher groups. For example, in the smartphone app industry, upselling and cross-selling strategies are deployed for the top groups. On the other hand, there is a tendency to focus on customer development for the lower groups.
Behavioral
Behavioral (Behavioral Attributes) is one of the segments in segmentation analysis used in marketing. It involves grouping customers based on actions taken towards products or services. Segmentation analysis divides users into four categories:
- Demographic (Demographic Attributes)
- Geographic (Psychological Attributes)
- Psychographic (Geographical Attributes)
- Behavioral (Behavioral Attributes)
Among these, the first three categories group users based on attributes such as age, gender, lifestyle, and regional characteristics. On the other hand, the behavioral category groups users based on their actions. Therefore, in user behavior analysis, the analysis is conducted from the perspective of behavioral attributes.
Behavioral focuses on user actions for grouping. This includes:
- Purchased products
- Date of last purchase
- Number of purchases
- Amount spent
- Purchase location and method
- Website traffic sources
- Website dwell time
- Page sessions on the website
- Actions on the website (e.g., requesting materials)
Methods and Tools for Checking User Behavior Analysis
In advancing user behavior analysis, primarily online tools are utilized. Representative methods include the following tools:
- Google Analytics
- Heatmap Analysis
Using Google Analytics
Using Google Analytics is beneficial for user behavior analysis. Google Analytics is a tool for measuring and analyzing data from a website you operate and is also valuable for SEO (Search Engine Optimization) strategies.
However, as of July 2023, the traditional Google Analytics, known as Universal Analytics (UA), has ended its service. It has been reborn as Google Analytics 4 (GA4).
In user behavior analysis, the following types of data can be checked:
- New and Returning User Numbers
- Devices and Browsers Used
- Views per User (Page per Session)
- Engagement Time (Duration of Stay)
- Conversion Numbers
New and Returning User Numbers
With GA4, you can measure new users visiting the website for the first time and returning users. The numbers of new and returning users can be checked through the following menu operation:
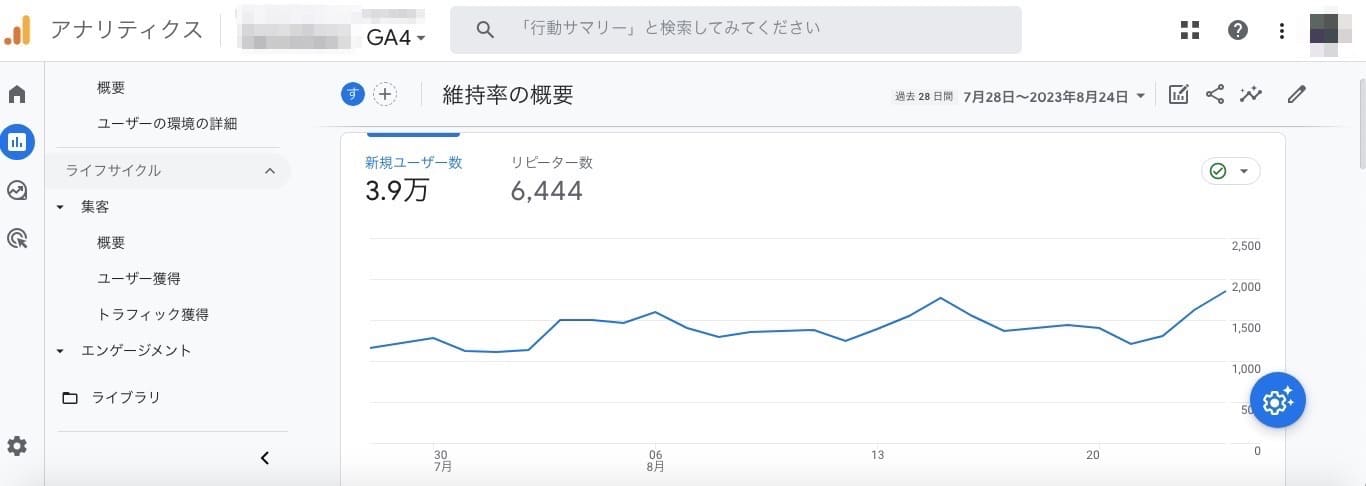
Furthermore, the following operation allows you to check the detailed actions of new users:
Here, you can check the inflow routes of new users. The checkable items mainly include:
| Item | Description |
|---|---|
| Organic Search | Number of users who accessed via search engines. |
| Direct | Number of users who accessed directly, such as through bookmarks or page reloads. |
| Referral | Number of users who accessed via external links. |
Additionally, you can check the “Number of Sessions with Engagement.” Sessions where the website was viewed for more than 10 seconds or more than two pages were displayed are counted as “Sessions with Engagement.” In simple terms, it counts when a user takes some action. If this number is extremely low, it may indicate that the website is difficult for users to use, so be cautious.
Devices and Browsers
With GA4, you can measure the devices and browsers used by users. In other words, you can understand “what kind of devices” and “what kind of browsers” are being used to visit your site. The user environment can be checked from the following:
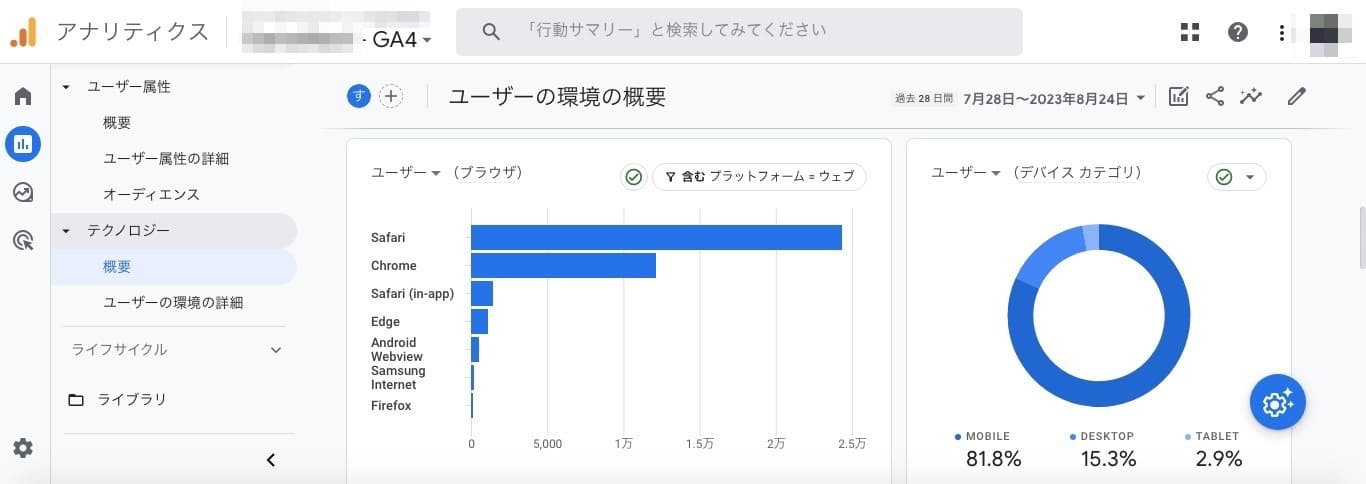
In this example, it is evident that the majority of access depends on smartphones. Furthermore, iOS users constitute the largest proportion. From this, it can be inferred that, for instance, web articles should be checked on iPhone devices during creation.
Views per User and Engagement Time
With GA4, you can check the page views (PV) of web pages.
Here, you can understand “how many seconds users are reading the page” and “how many pages a user is reading.” Such data can be checked through the following operation:
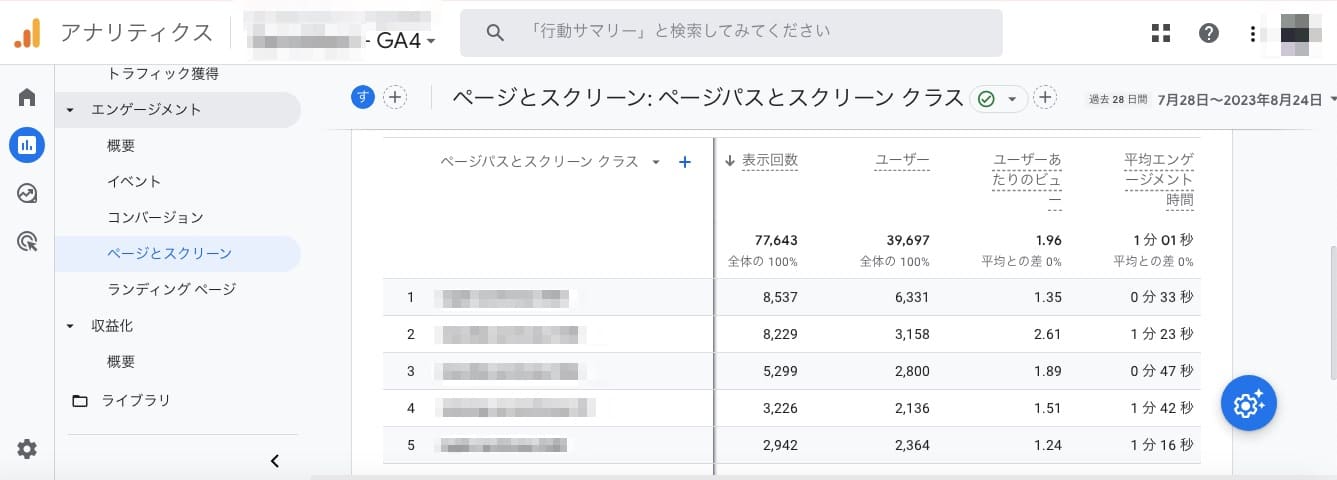
In this section, the following elements are displayed:
- Page Views
- Number of Users
- Views per User
- Average Engagement Time (Duration of Stay)
- Conversions
Among these indicators, let’s explain the concept of “Average Engagement Time (Duration of Stay).” In the example image, this number is “1 minute 01 second,” indicating that users are staying on the site. However, if this number is “less than 10 seconds” or extremely low, it may mean that users are not reading the articles. In other words, it becomes a significant challenge for the website to enhance the quality of articles to make them more appealing to visitors.
Conversion Numbers
With GA4, you can check the number of conversions (CV). Here, a conversion refers to the goals set on the website, also known as achievement points.
Conversions can be checked through the following operation:
The elements set as conversions on a website primarily include elements directly linked to revenue. These vary depending on the purpose of the website’s operation. For example, in the case of an EC site or a site aimed at merchandise sales, product purchases or payments become conversions. Other possible conversions include:
- Product Purchases
- In-App Purchases
- Ad Clicks
Additionally, by using the mechanism of event tracking, it is possible to set conversions. Event tracking is a system that measures the number of times a user performs a specified action within a website. Event tracking needs to be set individually according to the purpose of each website.
The measurable elements include:
- Number of Clicks on Specific Links
- Number of Downloads of Specific Files
- Number of Inflows from Specific URLs or QR Codes
Using Heatmap Analysis
Heatmap analysis is the process of displaying and analyzing user actions taken on a website. Specifically, it uses thermography or graphics to visually track user actions.
In heatmap analysis, the following four actions are primarily analyzed to understand user needs.
| item | Description |
|---|---|
| Scroll | The areas where users scrolled are represented in color.。 |
| Click | The areas where users clicked or tapped are represented in color. |
| Stay | The areas where users stayed and read thoroughly are represented in color. |
| Exit | The areas where users exited are represented in color. |
Tools for heatmap analysis are introduced in the following linked article.
Frequently Asked Questions About User Behavior Analysis
We introduce some common questions about user behavior analysis in an FAQ format.
Q: What is user behavior analysis called in English?
Answer: In English, user behavior analysis is referred to as “User Behavior Analytics.”
Furthermore, the abbreviation UBA is also used, derived from the initials of User Behavior Analytics. For clarity,
here are the direct translations of each English word:
- User: User
- Behavior: Behavior
- Analytics: Analysis
Q: What is the difference between UBA and UEBA?
Answer: UEBA adds “Entity” to UBA and refers to the analysis of both user and entity behavior.
UBA focuses solely on the behavior of individual users or groups. However, UEBA includes the analysis of the functioning of entities other than users.
Summary
As an SEO consultant, user behavior analysis revolves around analyzing users’ thoughts and needs based on their actions. Specifically, it involves analyzing users’ purchase dates, amounts spent, and actions on a website. However, the purpose of user behavior analysis is ultimately to identify user needs and reflect them in products or services. Those responsible for data analysis should work in cooperation with on-site personnel who can think from the users’ perspective.
Author Profile

Mr. Takeshi Amano is a graduate of the Faculty of Law at Nihon University. With 12 years of experience working in the advertising agency industry, he discovered SEO and began his research during the early days of SEO. He self-taught and conducted experiments and verifications on over 100 websites. Using this expertise, he founded Admano Co., Ltd., which is currently in its 11th year of operation. Mr. Amano handles sales, SEO consulting, web analytics (holding the Google Analytics Individual Qualification certification), coding, and website development. The company has successfully managed SEO strategies for over 2000 websites to date.