
Cross-Border Analytics: How to Measure Japan and Western Market Performance

A Western company, six months into its Japan market entry, pulls up its Google Analytics dashboard and sees encouraging numbers: sessions in, bounce rate reasonable, time on page solid. Then the client asks: “How many leads did we generate?” Nobody knows. The analytics setup was copied from the home market, the conversion events tracked are not the ones Japanese users actually complete, and the funnel report shows traffic entering, but nothing meaningful at the bottom. This is the analytics equivalent of the CRO failures covered in our Cross-Border CRO guide — the same structural mismatch, one layer deeper in the stack.

1. Why Standard Analytics Assumptions Break Across Borders
Most analytics configurations are built around implicit assumptions about how users behave: what a “good” session length looks like, what a conversion is, how long the funnel takes, and what a healthy bounce rate signals. When those assumptions are derived from one market and applied unchanged to another, the data produced is not wrong — it is systematically misleading.
Session length means different things in each market
Japanese users researching a considered B2B purchase routinely spend more time on a page than equivalent Western users — not because they are more engaged in a positive sense, but because the information density required to satisfy a Japanese user before they convert is structurally higher. A ten-minute average session on a Japan-facing page might mean users are finding the depth they need. The same metric on a Western-facing page might mean users cannot find what they are looking for and are hunting in frustration. Without market-specific benchmarks, both scenarios produce the same number, interpreted against the wrong baseline.
Bounce rate is especially unreliable across markets
Japanese users who arrive on a landing page and immediately begin the credibility scan described in our CRO guide may not trigger any interaction events before leaving — which registers as a bounce — even though the visit was a genuine evaluation that failed the trust threshold. That is not the same as a low-quality traffic problem, but standard bounce rate reporting treats it identically. Western users, by contrast, often bounce from a pricing page because they received what they came for. A high bounce rate on a transparent pricing page can be a sign the page is working, not failing.
Conversion events are not the same across markets
The most consequential mismatch is at the conversion layer. A standard Western setup tracks the inquiry form submission as the primary conversion, because in Western markets that is where the lead relationship begins. In Japan, the form submission is often the fifth or sixth interaction — preceded by a resource download, webinar registration, free diagnosis request, and possibly a phone call, never tracked at all. A Japan-facing setup that only tracks form submissions is invisible to the majority of journeys that are actually converting.
2. Setting Up Correctly: GA4 for Cross-Border Measurement
Property structure
| Setup | When to use | Key tradeoff |
|---|---|---|
| Single property, language dimension | Lower traffic, unified reporting preferred | Cannot set different conversion goals per market without workarounds |
| Single property, data streams per domain | Different domains per market (.com and .co.jp) | Clean traffic separation; shared exploration reports across markets |
| Separate properties per market | High traffic, distinct KPIs, separate reporting stakeholders | Maximum clarity; loses cross-market path data; more maintenance |
For most Western companies entering Japan, a single property with separate data streams per domain is the practical default: it keeps reporting unified while allowing market-specific filtering in every report.
Language and region segmentation
Before configuring conversion tracking, establish a consistent segmentation approach. GA4 does not automatically separate Japanese-language users from English-language users. At minimum, configure: user_language dimension filtering to separate ‘ja’ from ‘en’ sessions; country/region dimension to report Japan traffic distinctly; and hostname filtering if the Japanese site runs on a subdirectory rather than a separate domain.
Conversion event mapping
This is the highest-leverage configuration task for cross-border analytics. Map every realistic action a user might take — per market — as a named GA4 event, and mark the ones representing meaningful business signals as key events (conversions).
| Event name | Japan-facing priority | Western-facing priority |
|---|---|---|
| free_diagnosis_request | Primary | Secondary |
| consultation_booking | Primary | Primary |
| resource_download | High | Medium |
| webinar_registration | High | Medium |
| inquiry_form_submit | Primary (late-funnel) | Primary |
| phone_click (tel: links) | High — track as conversion | Low |
| trial_signup | Low relevance | Primary |
| demo_request | Low relevance | Primary |
| pricing_page_view | Low (pricing often not shown) | High intent signal |
| review_platform_click | Not applicable | High intent signal |
| linkedin_profile_click | Low | Trust signal |
| scroll_depth_70 | Key engagement proxy | Key engagement proxy |
| video_play_50 | Medium | High (product demos) |
3. Metrics That Lie: What to Deprioritize and Why
| Metric | Why it misleads cross-border | What to use instead |
|---|---|---|
| Bounce rate/engagement rate | Structural differences in how users read and leave pages; not a reliable quality signal across markets | Scroll depth events + time thresholds as engagement proxies |
| Average session duration | Japanese users spend longer by design; it does not indicate content quality without a market-specific baseline | Compare against your own historical baseline per market only |
| Pages per session | Navigation patterns differ; Japanese users explore more before converting | Track specific pre-conversion page sequences, not raw page count |
| “Direct” traffic | LINE URL sharing strips referrer data, inflating direct traffic, and masking social/referral in Japan | UTM parameters on all distributed links; flag unexplained direct spikes |
| Form completions only | In Japan, 70–80% of meaningful conversions happen before the inquiry form | Full micro-conversion event map across all journey stages |
| Mobile vs. desktop split | Japan’s high B2B mobile research rate makes Western-derived mobile benchmarks invalid | Set Japan-specific device benchmarks; analyze funnel by device separately |
4. The Metric Framework That Actually Works
The following tiered framework replaces single-metric dashboards with a layered measurement approach that reflects the actual user journey in each market direction.
1: Visibility metrics — is the site being found?
Organic sessions from the target market — month-over-month growth; do not mix markets in a single number
GSC impressions for target keywords — growing impressions signal keyword relevance even before rankings stabilize
GSC average position (top 20 keywords) — track weekly; Japan note: click distribution is somewhat flatter than in English search, making positions 4–8 more valuable than Western equivalents
CTR benchmarks — Japan informational: 2–4%; commercial: 4–8%. West informational: 3–5%; commercial: 5–10%
2: Engagement metrics — are users doing something meaningful?
Scroll depth ≥70% on key pages — target 40–55% of sessions (Japan), 30–45% (West); lower density copy = shorter expected scroll depth
Time on key pages — benchmark 3–6 minutes in Japan, 1.5–3 minutes in the West; compare within-market only
Evidence page views —% of sessions including a case study, team, or pricing page; high-value signal in both markets, different pages
Phone/email click events — high importance in Japan; lower weight in the West, where live chat dominates
Return visits before conversion — expect 2–5 sessions before inquiry in Japan; 1–2 in most Western categories
3: Micro-conversion metrics — is the funnel working?
Japan-facing: free diagnosis requests, webinar registrations, and resource downloads are the primary signals; form submission is a late-funnel event that requires the earlier stages to function first
Western-facing: trial signups, demo requests, pricing page views, and review platform clicks are the primary signals; the contact form is one of several equivalently valid endpoints
4: Macro-conversion metrics — is the business growing?
Inquiry form completions — tracked separately per market; never aggregated across markets
Lead quality by source — requires CRM integration; organic vs. paid vs. referral lead quality comparison
Time-to-first-conversion by channel — how long does organic traffic take to convert vs. referral vs. direct?
Revenue attributed to organic — requires CRM + revenue data; the ultimate ROI metric for the market entry program
5. Japan-Specific Analytics Signals
The phone click signal
Phone calls remain a meaningful B2B inquiry channel in Japan — more so than in most Western markets. Tracking click events on telephone links (filtering GA4 click events for tel: links) often reveals a conversion channel entirely invisible to standard setups. For some Japan-facing professional services pages, phone clicks represent 20–35% of all conversion-adjacent events.
LINE referral traffic appears as direct
LINE URL sharing via the in-app browser strips referrer data, causing LINE-driven traffic to arrive in GA4 as “direct.” This inflates the direct channel and makes LINE-driven organic reach invisible. Practical workaround: UTM parameters on all LINE-distributed content (utm_source=line&utm_medium=social), and treating unexplained direct traffic spikes in Japan as potential LINE signals.
Multi-session journeys are longer and more predictable
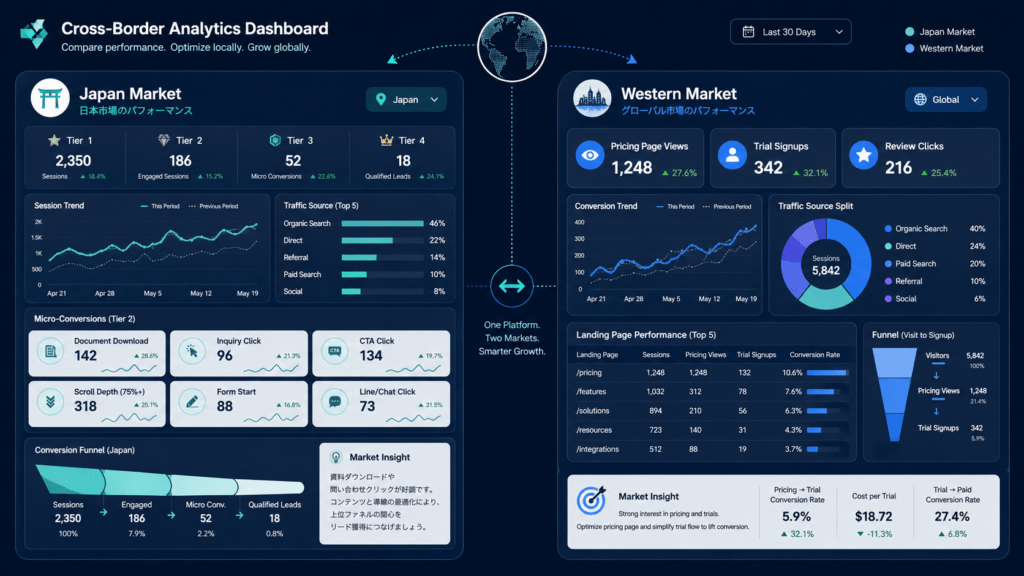
Japanese B2B buyers require more sessions before converting. GA4’s path exploration report shows that Japan-facing conversion paths tend to follow a consistent sequence — home → service page → case studies → process → form, rather than the varied, non-linear patterns common in Western markets. This predictability is a diagnostic advantage: identifying the specific step where users drop out shows exactly where the trust obstacle is.
6. Western-Market Analytics Signals
The pricing page as a conversion signal
On Western-facing pages, the pricing page is one of the strongest purchase-intent signals available — even without a completed form. A user who visits the pricing page, stays for more than 90 seconds, and returns within seven days has a materially higher conversion probability than one who never visits pricing. Setting up a GA4 audience capturing “pricing page engaged” behavior enables remarketing and sales outreach targeting that is standard in Western SaaS analytics — and almost never implemented by Japanese companies’ English-facing sites.
Review platform clicks as intent signals
When a Western visitor clicks through to G2, Capterra, or Trustpilot from your English-facing page, they are in active vendor evaluation mode. Track all outbound review platform clicks as conversion events in GA4, and treat a session containing a review platform click as high-intent even if no on-site form is completed.
LinkedIn profile clicks as trust signals
As covered in our Reverse Localization guide, Western B2B buyers routinely vet team members on LinkedIn before initiating contact. Tracking outbound LinkedIn clicks tells you whether the team section of your English-facing page is being used — and high clicks on a specific team member’s profile signal that their expertise is resonating with the audience.
Referral source quality varies more in the West
A visitor from a respected trade publication converts at a meaningfully different rate than one from a generic directory listing, even if session behavior looks similar in GA4. Building referral source conversion rate reports by source/medium is a standard Western analytics practice that Japanese companies frequently skip.
7. Funnel Analysis Across Different Conversion Journeys
Because the conversion journey is structurally different in each direction, funnel reports must be built differently for each market.
Conversion funnel structure by market direction
Japan-facing funnels are longer and more sequential; Western-facing funnels are shorter and more likely to compress stages 2–3 into a single session.
Reading drop-off between stages
In GA4’s funnel exploration, a large drop-off between Stage 1 and Stage 2 on a Japan-facing page means users are not clicking through to evidence pages — the landing page is not generating enough curiosity about the proof. A large drop between Stage 2 and Stage 3 means users are reading the evidence but not taking an intermediate action — the intermediate CTAs are too weak, too hidden, or not compelling enough.
On a Western-facing page, a large drop between Stage 1 and Stage 2 most commonly means the self-evaluation path is blocked — no pricing, no trial, no immediate next step that does not require talking to a salesperson. A large drop between Stage 2 and Stage 3 typically means the follow-up process (the email after a demo request, the trial onboarding) is failing, not the page itself.
8. Reporting for Cross-Border Stakeholders
Analytics reporting for cross-border market entry faces a structural challenge: decision-makers in the home market use home-market intuitions to interpret numbers from a market they have never operated in. Several practices reduce this risk materially.
Always benchmark against market-specific baselines
A 40% engagement rate on a Japan-facing page is not the same number as a 40% engagement rate on a US-facing page. Make market-specific benchmarks explicit in every report — include a “what this means in this market” annotation for every KPI that does not have an intuitive cross-border interpretation.
Report micro-conversions alongside macro-conversions
For Japan-facing reporting, especially, showing only form submissions consistently understates performance to stakeholders who do not understand the Japanese conversion journey. Show the full tier structure: how many users completed each micro-conversion stage, what percentage advanced to the next, and how many ultimately reached a macro-conversion.
Use cohort analysis to show compounding improvement
A monthly snapshot can make progress look flat even when cohort performance is improving — because early months drag down averages. GA4’s cohort exploration report, set to show 12-week cohorts of organic sessions by market, makes compounding improvement visible in a way that monthly aggregates do not.
Separate organic from paid in every report
Mixing organic and paid traffic in top-line session counts routinely produces misleading signals. Track whether organic performance is improving independently of paid spend — that is the metric that reflects the health of the market entry strategy.
9. Analytics Setup and Reporting Audit Checklist
GA4 configuration
- Separate data streams or properties per market/language
- Language dimension filter applied across all reports
- The country/region dimension separates Japan from global traffic
- UTM parameters on all campaigns and social links
- tel: link click events tracked for Japan-facing pages
- Outbound link clicks tracked (review platforms, LinkedIn)
- GA4 linked to Google Search Console
Japan-facing events
- Free diagnosis/audit request as key event
- Resource download (PDF, checklist, guide) tracked
- Webinar registration tracked
- Consultation booking tracked
- Inquiry form submission tracked
- Phone clicks (tel: links) tracked as key events
- Scroll depth 70% configured on key pages
Western-facing events
- Free trial signup or account creation tracked
- Demo request form tracked
- Pricing page view as an engagement event
- Contact form submission tracked
- Live chat initiation tracked
- G2 / Capterra / Trustpilot clicks tracked
- LinkedIn team profile clicks tracked
- Video play 50% on product videos tracked
Funnel reports
- GA4 funnel exploration built per market using market-specific stages
- Drop-off rates between stages are identified and documented
- Path exploration report is active for pre-conversion sequences
- 12-week cohort analysis configured by market
Search Console
- Custom exploration showing impressions, CTR, and position by target market country
- Weekly tracking for the top 20 commercial keywords per market
- Impression growth is monitored separately from click/ranking data
Reporting standards
- Market-specific benchmarks documented in all reports
- Micro-conversions shown alongside macro-conversions
- Organic and paid traffic are reported separately
- “Direct” traffic flagged as partially attributed in Japan reports
- The monthly report includes a cohort comparison
Summary
Standard analytics setups built for the home market produce systematically misleading data when applied to cross-border pages — not because the numbers are wrong, but because they are interpreted against the wrong baseline assumptions.
Session duration, bounce rate, and pages-per-session carry different meanings across markets; deprioritize them in cross-border reporting in favor of market-specific engagement proxies like scroll depth and event sequences.
The most consequential setup decision is conversion event mapping: Japan-facing sites must track the full multi-touch journey (diagnosis requests, downloads, webinar registrations, phone clicks); Western-facing sites must track pricing page visits, review platform clicks, and trial signups as conversion-adjacent signals.
GA4’s event-based model handles cross-border measurement well if configured deliberately: separate data streams, language dimension filtering, UTM parameters on LINE-shared links, and a full micro-conversion event map per market.
Build separate GA4 funnel explorations for each direction: Japan funnels are longer (5 stages) and more sequential; Western funnels are shorter (3 stages) and more likely to compress into a single session.
Reporting for cross-border stakeholders requires explicit market-specific benchmarks, micro-conversion visibility, 12-week cohort analysis, and strict organic/paid separation in every report.
Frequently Asked Questions
Do we need separate GA4 properties for our Japanese and English sites?
Not necessarily. A single property with separate data streams per domain works well for most setups, preserving the ability to run cross-market path analysis. Separate properties are worth the added maintenance overhead only when the two markets have completely distinct KPIs, separate analytics stakeholders, or very high traffic volumes that make a single property unwieldy.
Our Japan-facing site shows a high bounce rate. Does that mean our SEO is sending wrong traffic?
Not automatically. High bounce rate on a Japan-facing page more often indicates a credibility scan failure — users arriving and leaving within seconds because first-view trust signals are absent — rather than a keyword-level traffic quality problem. Check scroll depth data first: if users leave without scrolling at all, the first-view trust signals are the problem. If users scroll but engage with no events, the content is not creating a clear next step.
We are only tracking form submissions as conversions. Is that sufficient?
For a Japan-facing site, no. Form submissions alone miss the majority of the conversion journey and consistently understate both traffic quality and funnel health. Implement the full micro-conversion event map before drawing any conclusions about Japan-facing performance. For a Western-facing B2B site, adding pricing page views, review platform clicks, and demo requests alongside form submissions provides significantly more diagnostic visibility.
How do we handle the LINE referral attribution problem?
Tag all URLs distributed via LINE with UTM parameters (utm_source=line, utm_medium=social) before sharing. This overrides the referrer stripping and allows accurate attribution in GA4. For organic word-of-mouth sharing via LINE — where you cannot control the URL — treat unexplained direct traffic spikes that correlate with LINE-distributed content as LINE-attributed and note this in reports. It is an attribution gap GA4 cannot fully close without tagged links.
Should we use GA4 or a different analytics platform for cross-border measurement?
GA4 is the practical default: free, integrated with Google Search Console and Ads, and better suited to multi-touch funnels than Universal Analytics. Its main cross-border limitation is that attribution modeling was largely developed around Western user behavior patterns and may underweight multi-session, trust-sequential journeys. Supplementing GA4 with a heatmap and session recording tool — Microsoft Clarity (free) or Hotjar— provides the qualitative why behind the quantitative what, which is especially diagnostic in cross-border analytics work.
Not sure what your cross-border analytics is actually telling you?
We audit Japan-facing and Western-facing analytics setups, rebuild conversion event maps for each market, and produce reporting frameworks that reflect the actual user journey — not home-market assumptions.
Tokyo SEO Maker is a web marketing consultancy based in Tokyo, Japan, specializing in SEO strategy, analytics, and digital market entry for businesses entering and competing in both the Japanese and Western markets. Contact us for a free consultation.